
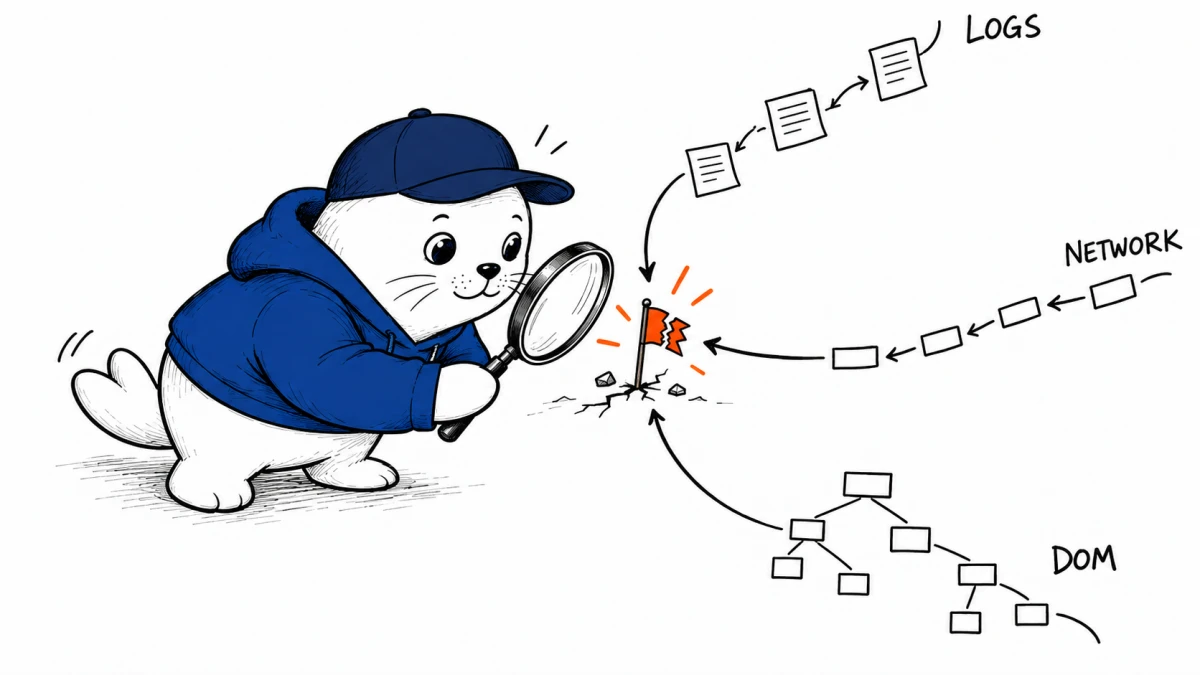
Cloudflare Browser Run session recordings can now show searchable console logs, network requests and a reconstructed end-of-session DOM inside a new Inspect panel. The September 18 release gives teams a practical way to investigate a failed browser-agent run without immediately trying to reproduce it.
The change matters because browser automation failures rarely live in a screenshot alone. A page can look correct while an API request returns 403, a script throws an exception or a selector disappears after a client-side render. The Inspect panel puts those signals beside the replay.
What Cloudflare added
| Inspect surface | Evidence available | Best use |
|---|---|---|
| Logs | Captured console output, search and level filters | Find JavaScript errors, warnings and agent instrumentation |
| Network | Method, status, headers, payload, response and timing waterfall | Trace failed requests, redirects, latency and unexpected responses |
| DOM | Expandable final page structure and copyable reconstructed HTML | Check whether the target element existed when the run ended |
| API export | Recorded network activity as raw JSON or HAR | Join browser evidence with an incident or observability workflow |
For sessions with several tabs, Cloudflare says the Inspect panel follows the tab selected in the recording viewer. That detail is especially useful for sign-in redirects, payment handoffs and workflows that open a result in a new tab.
The debugging workflow starts with a timestamp
Begin at the last visible successful action in the recording. Note its time, then inspect the network waterfall around that moment. A request that failed before the click can explain a missing control; a request that failed after the click can explain a stalled transition. Next, filter the console log to errors and warnings, then compare the final DOM with the selector or accessible name the agent expected.
- Find the last successful user-visible action in the replay.
- Check requests immediately before and after it.
- Confirm status, redirect chain, response and timing.
- Search console output for the same time window.
- Inspect the final DOM for the expected control and state.
- Export HAR or JSON when the evidence must be attached to an incident.
What the final DOM can and cannot prove
The DOM view is a reconstruction of the page structure at the end of the recording. It can show that an element was present, absent or unexpectedly nested at that point. It does not, by itself, reconstruct every intermediate mutation. A control that existed briefly and disappeared may require the replay, console timing and request sequence to explain.
That limitation changes how teams write incident notes. Prefer: “the target button was absent from the final reconstructed DOM after the checkout request returned 403.” Avoid: “the button never existed.” The first statement is supported by the captured evidence; the second makes a broader claim than the artifact proves.
Recording has to be enabled before the failure
The Inspect panel is not retroactive. Cloudflare says recording must be enabled when the browser session is launched. After the session closes, the recording is available through Browser Run > Runs in the Cloudflare dashboard. Teams should therefore decide which production-like test runs need recording before an incident occurs.
- Enable recording for release candidates, flaky end-to-end tests and high-value workflows.
- Attach a run identifier to the application trace or test result.
- Define retention and access rules for recordings that may contain user data.
- Redact secrets in application logs before they can reach a recording.
- Test a multi-tab flow so investigators know how tab selection changes the panel.
Network capture raises a data-handling question
Headers, request payloads and responses can contain session identifiers, personal data and business records. The new visibility is valuable, but it increases the importance of data minimization. Teams should know which fields their application sends, who can open recordings, how long artifacts remain available and whether exported HAR files enter a separate ticketing or storage system.
Do not treat an observability surface as a safe place for credentials. Use scoped tokens, avoid logging secrets, keep test accounts separate and give exported evidence the same handling rules as other production traces.
Session evidence complements browser guardrails
Cloudflare added hostname guardrails to Browser Run earlier in September. Guardrails constrain where a session can send HTTP and HTTPS requests; recordings help explain what happened inside that boundary. The two controls solve different problems. An allowlist limits reachable destinations, while logs, network traces and the DOM help determine why an allowed workflow succeeded or failed.
This is the same separation we recommend in our WebMCP permission-boundary guide: authorization decides what an agent may do, while audit evidence shows what it tried and what the system returned. Our Playwright Workspaces guide covers the adjacent question of isolating remote browser-agent execution.
A minimum acceptance test for the Inspect panel
| Test | Failure to inject | Evidence that should appear |
|---|---|---|
| Console | Throw a controlled client error | Searchable error with useful context |
| Network | Return 401 or 500 from a test endpoint | Status, response and timing near the failed action |
| DOM | Hide or rename the target control | Final structure confirms the changed state |
| Multi-tab | Open a redirect in a second tab | Panel changes with the selected tab |
| Export | Download the session network activity | HAR or JSON can be parsed by the incident workflow |
The practical verdict
Cloudflare Browser Run session recordings now carry enough context to answer three different questions: what the page logged, what the network returned and what structure remained when the run ended. That makes replay more useful for browser agents and flaky automation. It does not eliminate reproduction, tracing or application-level audit logs, but it can turn an opaque failure into a testable hypothesis much faster.
Primary sources
For a complementary control-plane approach, our Fastly AI Firewall analysis explains request screening, streaming limitations and model-routing budgets.
Checked September 21, 2026. Product behavior is attributed to Cloudflare. Security and debugging guidance is MustHave.ai analysis.