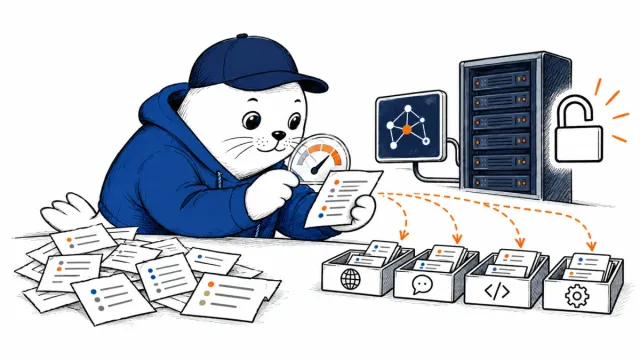

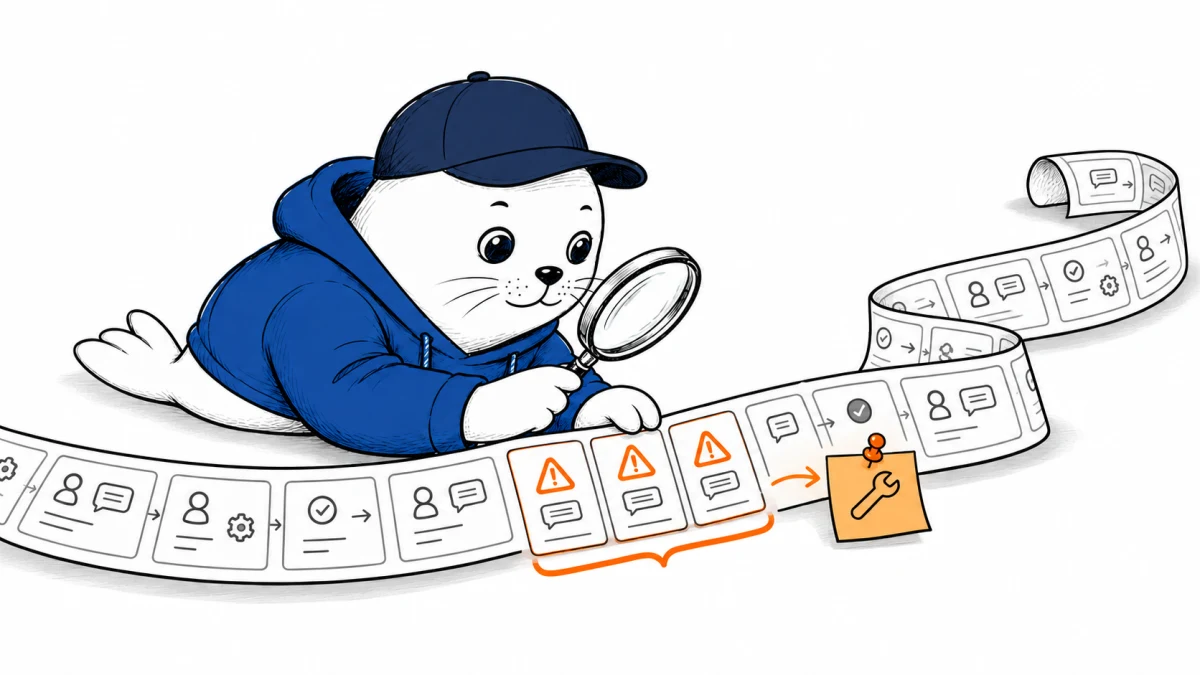
An agent can fail in a way no dashboard was told to count. Microsoft wants Foundry to find those recurring patterns in production traces and turn them into a testable repair plan. That is the promise of Insights in Foundry, now in public preview.
What the preview adds
Microsoft’s September 24 Foundry announcement says Insights analyzes production agent traces to surface both recurring issues and problems a team didn’t know to look for. For each issue, Microsoft says it provides supporting traces, a likely cause, and a recommended next action. It is a diagnostic aid, not an automatic fix and not proof that the proposed cause is correct.
This fills a gap between per-run debugging and aggregate metrics. A latency chart can show that calls became slower, while individual traces can show what happened in one call. Insights is intended to connect repeated trace behavior into a pattern worth investigating. A production team should still inspect the underlying examples before changing an instruction, tool, or model.
The operating loop Microsoft is building
Insights is one part of a broader Foundry cycle: observe live behavior, understand the problem, define an evaluation, test a change, and validate the result before deploying it. Microsoft separately says a rubric evaluator, trace-to-dataset generation, and an agent optimizer are planned for general availability later in September. Those timelines are product targets, not a reason to mark all of the surrounding tools GA today.
Consider an order-status agent that repeatedly calls a shipping tool after it already received a complete answer. An insight might cluster the redundant calls and suggest a tool-use change. The safe next step would be to examine representative traces, write an evaluation that flags redundant calls, compare the existing and revised agent on held-out examples, and monitor the change after release. That workflow shows how to use the feature, not that Microsoft has documented this exact incident. For cross-agent traces, our Foundry A2A guide maps the delegation boundary that a single-run chart can miss.
Trace quality and privacy come first
Insights cannot find meaningful patterns in absent or misleading telemetry. Microsoft’s tracing guide describes sending agent telemetry to Azure Monitor Application Insights. Before using trace analysis, verify that runs carry consistent identifiers, tool spans, and outcome signals. Manually sample a handful of traces to see whether the data can reconstruct the failure.
Richer visibility also comes with a privacy cost. Microsoft’s sensitive-content guidance notes that prompts, responses, system instructions, and tool arguments or results may be captured. Decide which fields to retain, who can view them, and when to remove them before increasing trace volume. More data is not automatically better observability.
A practical preview test
Pick one agent with a known recurring fault and enough consented trace data to investigate it. Ask whether Insights finds the fault, whether its supporting traces are representative, and whether the recommended action improves a separate evaluation set without harming another metric. Keep the preview’s suggestions behind human review. If the suggested repair adds model calls, apply a completed-task budget using the agent cost-controls framework. The test is whether the system reduces time to a verified fix, not whether it produces an impressive explanation.