
The hardest production failure is often not the red screen. It is the system that stays green while customer outcomes quietly deteriorate.
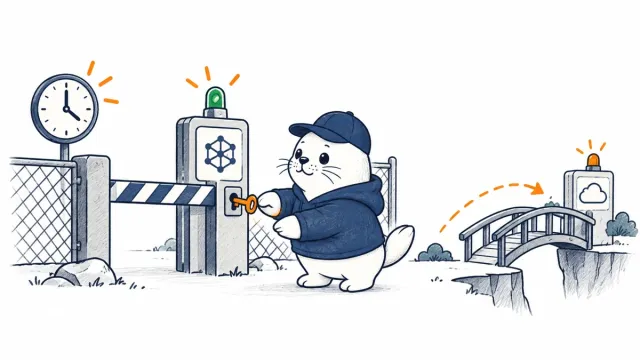
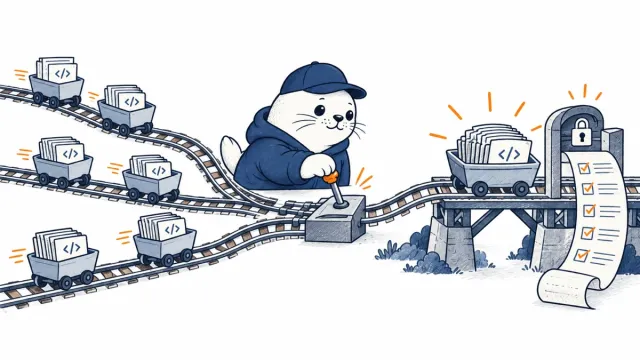
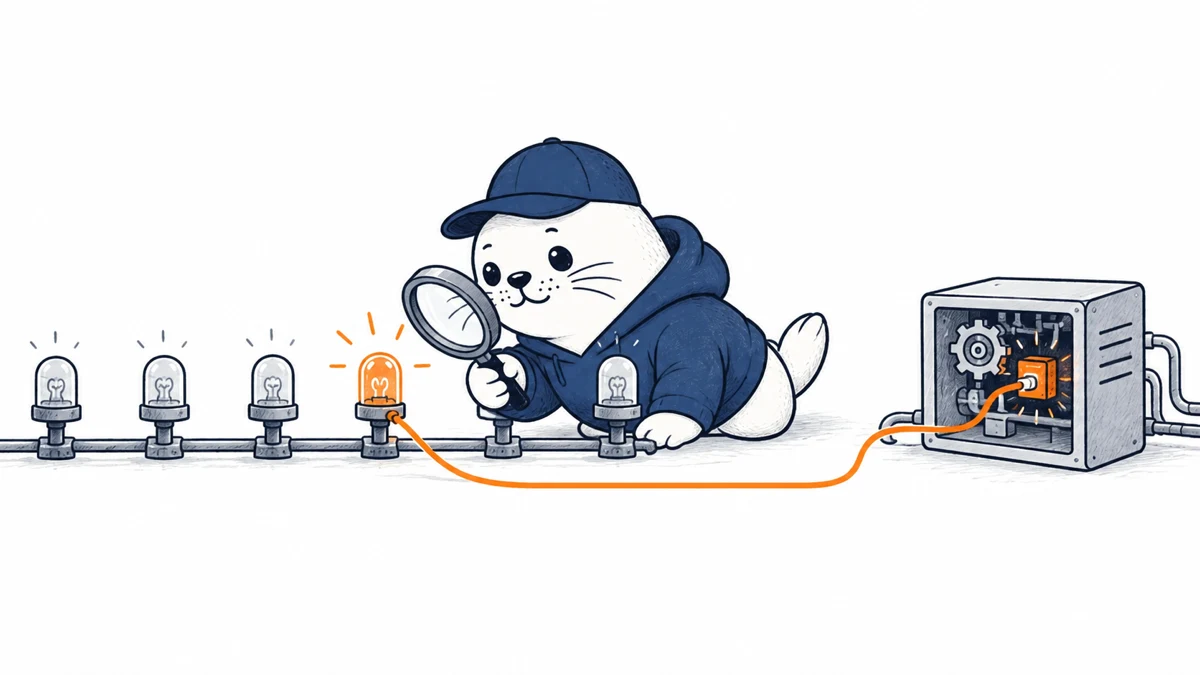
Databricks RADAR is a published architecture and scaffold for detecting gray failures: problems that do not trigger a clean outage but still damage reliability, revenue or model quality. Databricks describes a four-stage loop covering reliability metrics, streaming anomaly detection, alerting and root-cause analysis.
A gray failure can look healthy from the outside
An endpoint may continue returning HTTP 200 while its useful-answer rate falls. A checkout may remain available while one payment route fails. An AI agent may complete tasks while tool retries, latency and incorrect actions rise. Availability alone cannot capture these failures.
| Surface | Gray-failure signal | Outcome metric |
|---|---|---|
| AI model | Abstentions, refusals or retrieval errors increase | Accepted answer rate |
| Agent | Tool retries and loops rise | Completed task without intervention |
| Commerce | One route slows or rejects | Successful conversion |
| Billing | Usage records arrive but totals drift | Reconciled invoice accuracy |
The RADAR loop has four stages
- Reliability metrics: calculate signals close to the customer outcome.
- Anomaly detection: compare the live stream with learned recent behavior.
- Alerting: notify only when the evidence crosses a defined risk boundary.
- Root-cause analysis: attach the dimensions, changes and traces that help an operator act.
Databricks says its implementation uses SPOT, an unsupervised streaming method, with the previous 14 days as training history and a single risk parameter. That is attractive for services where labels are scarce, but seasonality, launches and one-off campaigns can still create false alarms.
Start with the metric before choosing the detector
A sophisticated anomaly detector cannot rescue a metric that is detached from user value. For an AI support agent, response count is weak; resolved cases without escalation is stronger. For retrieval, vector-query success is weak; grounded answer acceptance is stronger. The Google agent anomaly-detection preview raises the same operational question: what behavior is actually being measured?
Databricks reports large gains, not universal guarantees
Databricks reports a 95% reduction in incident-discovery time and precision above 90%. These are first-party results from the described environment. Precision depends on the event definition, time window, traffic volume and threshold. A team should reproduce performance on its own historical incidents before adopting the numbers as an expectation.
How to run a useful backtest
- Choose three known incidents and two high-traffic periods that were not incidents.
- Train only on data that would have been available before each event.
- Measure time-to-first-useful alert, not first statistical deviation.
- Count duplicate and unactionable alerts.
- Attach root-cause dimensions without leaking sensitive customer data.
- Compare the detector with a simple seasonal baseline.
Root-cause evidence should travel with the alert
An alert that says only “anomaly detected” sends humans back to manual exploration. Include the affected service and segment, start time, baseline, recent deploys, model version, prompt version, tool failures and trace samples. That evidence makes the pattern compatible with production controls such as those in the Cloudflare production AI guide.
RADAR is a scaffold, not a magic product switch
The public material is best understood as an implementation pattern that can be assembled from Databricks components. Teams still own metric definitions, data quality, incident labels, notification policy, access control and response playbooks. An AI agent can help construct the system, but it should not silently change detection thresholds or close incidents without review.
Control the detector’s own feedback loop
When operators mark an alert useful or noisy, that judgment can improve thresholds and routing. It can also create bias if busy teams dismiss inconvenient alerts or if one incident class dominates the history. Preserve the original score, threshold, operator action and later incident outcome. Review changes to the risk parameter like code: record an owner, reason, test result and rollback value. The anomaly system itself needs drift monitoring because traffic patterns, product launches and model versions change the baseline it learns.
The practical verdict
RADAR is useful because it treats silent degradation as a full operational loop rather than a chart. Its value will come from outcome-linked metrics, disciplined backtesting and alerts that carry enough evidence to act. The reported performance is promising, but each production environment must reproduce it.
Start with one consequential service and one operator team before expanding the pattern across an organization.
Primary source
Checked September 20, 2026. Performance figures are Databricks-reported and should be independently reproduced on the target workload.