
You can choose the right open model and still buy the wrong result. The API endpoint sits between the benchmark and your application, and its limits can quietly change the answer.
Artificial Analysis’s new Endpoint Accuracy Index puts numbers on that gap. The firm ran the same model through multiple serverless providers, then compared each endpoint with a self-hosted reference across tool calling, scientific reasoning, and long-context recall. The early results show that the provider can matter almost as much as the model name.
This is not a universal ranking of API companies. It begins with three models (GLM-5.2, gpt-oss-120b, and DeepSeek V4 Pro) and a defined test harness. Its value is narrower and more practical: it gives builders a repeatable way to ask whether a hosted endpoint preserves the capability they thought they were purchasing.
What the Endpoint Accuracy Index measures
The official methodology uses three evaluation areas with equal weight. BFCL-500 tests tool calling with 500 questions repeated three times. HLE-250 uses 250 scientific-reasoning questions repeated ten times. AA-LCR-25 tests long-context recall with 25 questions repeated ten times.
Tool calling
Can the endpoint preserve structured tool use across a large task set?
Scientific reasoning
Does the response have enough room and fidelity to finish difficult reasoning?
Long context
Can the serving stack retrieve information from a large supplied context?
For each area, Artificial Analysis divides the endpoint score by its reference score. It then averages those three percentages. An endpoint reaches reference parity when its result sits inside the reference run’s 95% confidence interval. Parity does not mean perfect accuracy; it means the hosted endpoint performed similarly to the firm’s reference configuration.
Three ways the same model diverged
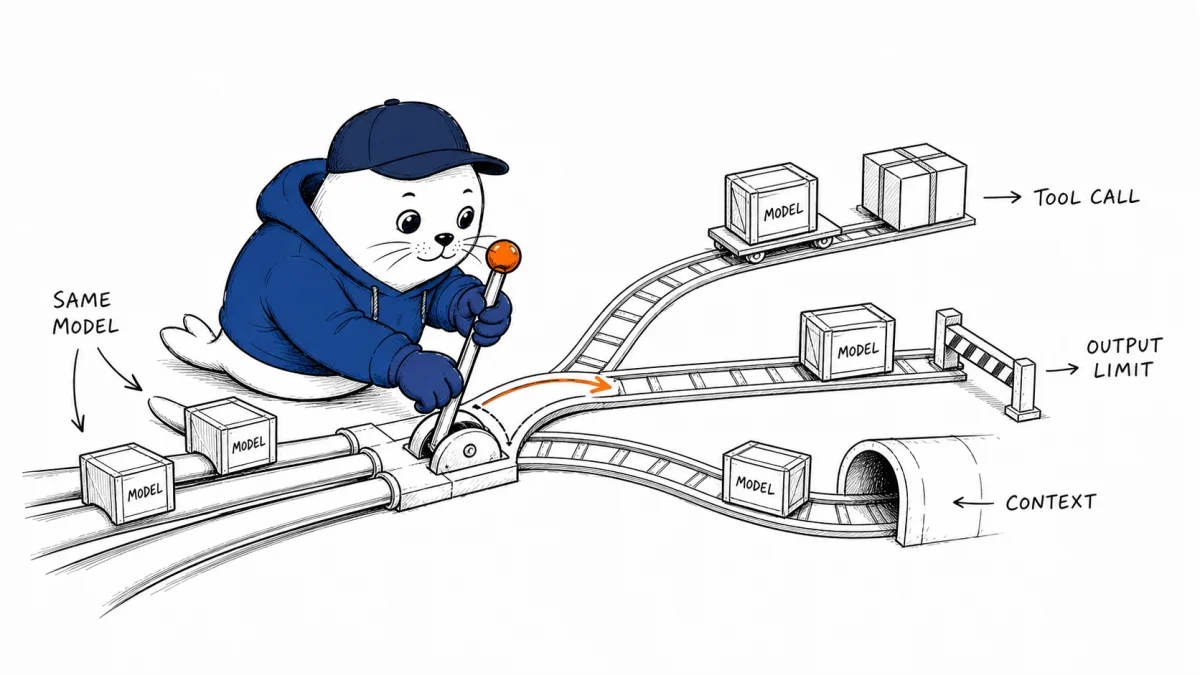
The initial model set exposes different failure patterns. Artificial Analysis reports that restrictive output limits hurt GLM-5.2 on scientific reasoning. The most restrictive endpoints scored half the reference result or less on HLE-250 because some responses stopped before their reasoning finished.
For gpt-oss-120b, the firm found wider variation in tool calling: some endpoints scored about 22% on BFCL compared with a 37% reference. Context limits, output limits, serving configuration, and tool-call handling can all contribute to such gaps. The public index measures the outcome; it does not prove one hidden cause for every provider.
DeepSeek V4 Pro behaved differently. Most tested endpoints reached reference parity, and its first-party endpoint scored slightly above the reference. That is a useful reminder that provider variance is not automatically degradation. A hosted stack can match or occasionally exceed a particular reference run.
Do not overread the launch set
These are Artificial Analysis measurements for selected models, providers, settings, and dates. They are evidence that endpoint variance is real, not proof that one provider is always better across every model.
The 100% reference is not perfection
An index value near 100% means the endpoint retained the reference configuration’s measured capability. It does not mean the model answered every question correctly, avoided every hallucination, or will behave identically inside your agent.
The calculation is intentionally simple. Imagine a hypothetical endpoint (not a measured provider) that retains 90% of reference tool-calling performance, 80% of scientific reasoning, and 100% of long-context recall. Its equally weighted index would be (90 + 80 + 100) / 3 = 90%. That headline still hides the 20-point reasoning deficit, which may be the only dimension your application cares about.
| Signal | What a gap can mean | Builder response |
|---|---|---|
| Tool calling | Schema, parsing, or serving behavior may differ. | Replay your real tools and validate arguments, not just final text. |
| Scientific reasoning | Output ceilings can stop a valid reasoning path. | Measure truncation and completion rate at your chosen limit. |
| Long context | Advertised context and usable retrieval can diverge. | Test documents shaped like your production payloads. |
A provider test that costs less than a bad switch
A team does not need hundreds of academic questions to catch the most expensive endpoint failures. Start with 30 to 50 representative jobs: real tool calls, long documents, difficult instructions, and known edge cases. Pin the model version and the requested settings, then run the same cases through each candidate endpoint.
Record success, truncation, invalid tool arguments, latency, token use, retries, and price per completed job. A cheaper token can become an expensive task if it needs repeated calls or human repair. This is the same reason our Qwen benchmark analysis recommends preserving the model, endpoint, harness, and benchmark version together.
How to compare endpoints before migrating
Endpoint acceptance card
- Pin what can be pinned: model build, reasoning effort, context, output limit, temperature, and tool schema.
- Use production-shaped cases: include long inputs, failed tools, ambiguous instructions, and permission denials.
- Score dimensions separately: a single average should never hide a critical failure mode.
- Measure completed work: include retries, repair time, latency, and cost per accepted result.
- Keep a reversible route: canary the new endpoint and preserve the old one until failure rates stabilize.
Migration checks also belong beside lifecycle planning. When a model is retired, our Claude Opus 4.1 migration guide recommends testing every fallback path rather than assuming a replacement endpoint is equivalent. For long-running agents, pair endpoint tests with the restart and audit controls in our Meta Muse Code handoff analysis.
My verdict: benchmark the endpoint you will actually call
The Endpoint Accuracy Index is useful because it removes a comforting fiction: a model identifier does not guarantee an identical product. Provider configuration, output ceilings, context handling, serving precision, tool parsing, and bugs can change the capability delivered to your application.
Use the index to identify questions, not to outsource the purchase decision. Pick the dimensions your workload cannot afford to lose, replay your own cases, and compare cost per accepted task. The endpoint in your architecture (not the model card in your slide deck) is what users experience.
Go deeper
- Read Artificial Analysis’s Endpoint Accuracy Index methodology and initial findings.
- Inspect the linked provider-level tables before using an average as a purchasing shortcut.
- Build a small endpoint replay set from the failures your team has already paid to fix.
Which capability would make you reject a cheaper endpoint even if its average score looked competitive?
Checked August 7, 2026. Scores and provider coverage may change as Artificial Analysis adds endpoints and models. Musthave.ai did not independently rerun the complete evaluation suite; provider comparisons above are attributed to the published index.