

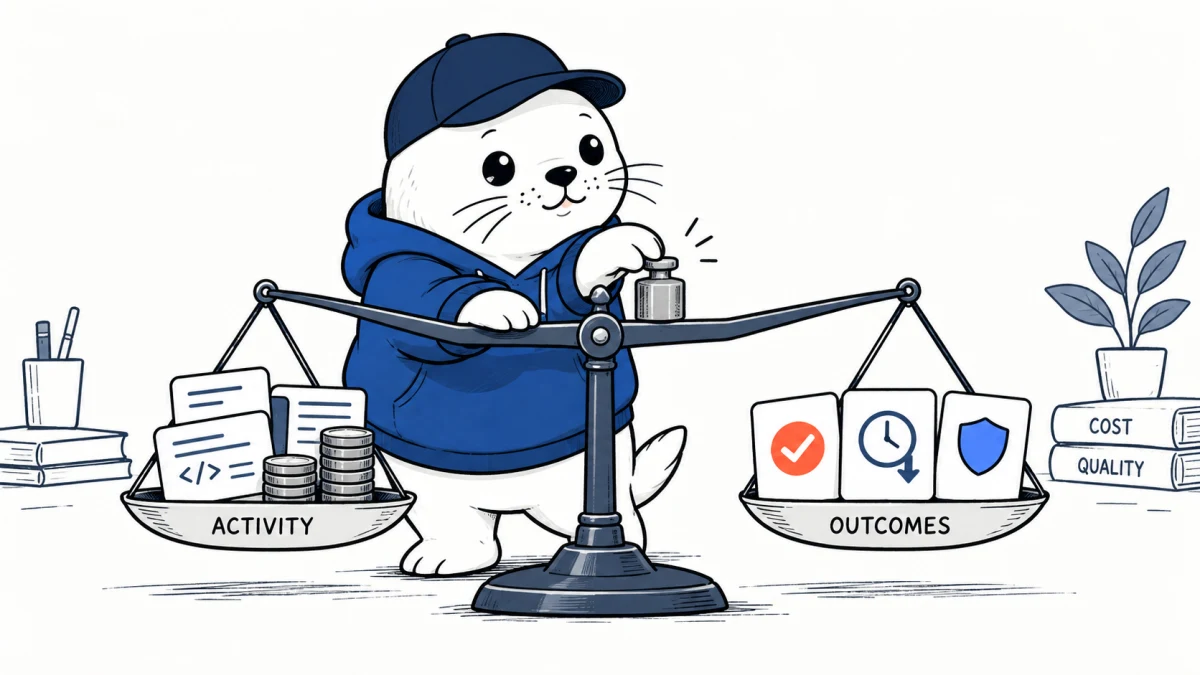
OpenAI has introduced business-value analytics that connect ChatGPT Work and Codex activity with cost, task and outcome data. The new Admin Console can help organizations move beyond seat counts, but its repository and usage metrics still need quality and business context before they become evidence of return on investment.
The system brings together usage, cost, task classification and outcome signals. Administrators can also access the data through an Admin plugin and API, making it possible to combine OpenAI activity with internal finance, engineering or operations data.
The value chain has four layers
| Layer | Example signal | What it answers |
|---|---|---|
| Adoption | Active users and usage frequency | Who is using the tools? |
| Work | Task category, model, reasoning and skill | What are they trying to do? |
| Cost | Usage and plan or compute cost | What does the activity consume? |
| Outcome | Merged commits, reviews or linked business result | What changed after the work? |
The layers should not be collapsed into one number too early. High adoption can indicate value, experimentation or inefficient repetition. A merged commit can contain an important fix or a large amount of rework. The link between activity and outcome needs to remain inspectable.
Task analytics depend on sampled messages
OpenAI says a task classifier can sample and group messages to show the kinds of work people perform. The analysis can include model, reasoning level, response speed, plugin and skill context. That can reveal whether teams use AI for drafting, analysis, coding or support, but sampling and classification introduce uncertainty.
- Document the sampling rate and excluded workspaces.
- Review classification accuracy on local terminology.
- Separate individual experimentation from recurring workflows.
- Protect sensitive message content during analytics.
- Track category changes after product or policy updates.
Codex Outcomes connects activity to repository events
Codex Outcomes can report merged commits, lines associated with Codex and review activity. Those are useful operational signals because they move beyond prompt counts. They are not quality scores. More generated lines can mean more delivered functionality, more verbose code or more cleanup work.
A stronger engineering view pairs repository activity with cycle time, escaped defects, review time, rollback rate, security findings and maintenance work. Our Codex versus Claude Code guide compares the tools, while the outcome dashboard can show how a selected workflow performs inside one organization.
The 245 percent example is hypothetical
OpenAI includes a 245 percent return example to illustrate how organizations might calculate value. It is hypothetical, not a measured result that every deployment should expect. Customer figures in the announcement are also company-reported and may use different baselines, scopes and accounting methods.
A credible ROI calculation should state the time period, population, fully loaded labor cost, AI cost, implementation cost and quality adjustment. It should also show the counterfactual: what the same team would likely have produced without the tool.
Use a balanced scorecard instead of one productivity number
| Dimension | Measure | Warning sign |
|---|---|---|
| Speed | Cycle time to accepted output | Fast drafts with slow review |
| Quality | Defects, corrections and rework | More output with rising fixes |
| Adoption | Repeat use in eligible workflows | High activity concentrated in a few testers |
| Cost | Total AI and implementation cost | Usage grows faster than accepted value |
| Business result | Revenue, margin, risk or service outcome | Repository activity with no customer effect |
The Admin plugin and API enable local definitions
The plugin and API are important because business value rarely lives in one vendor dashboard. A support team may need resolution time and customer satisfaction. A legal team may need accepted clauses and review risk. An engineering team may need incident rate and deployment frequency.
Teams should join only the minimum data needed, use stable identifiers and define retention for analytics records. The dashboard should support a question, not create a new store of sensitive employee activity without a clear policy.
A 30-day measurement plan
- Select two recurring workflows with known baselines.
- Define accepted output and quality before collecting AI activity.
- Record usage, cost, completion time, review time and rework.
- Compare AI-assisted and non-assisted work with similar difficulty.
- Interview users about work shifted outside the measured system.
- Publish the result with assumptions and confidence limits.
The plan also helps interpret scientific productivity. Our AI in science study analysis shows why gross time saved should be separated from time spent verifying the result.
The practical verdict
OpenAI’s business-value analytics provide a better starting point than licenses and prompt counts alone. The opportunity is to connect activity with real outcomes. The risk is to turn convenient telemetry into a productivity score without accounting for quality, rework, privacy and the work that the dashboard cannot see.
Primary source
Checked September 17, 2026. Product capabilities and examples come from OpenAI. Scorecard design, limitations and the 30-day plan are MustHave.ai analysis.