

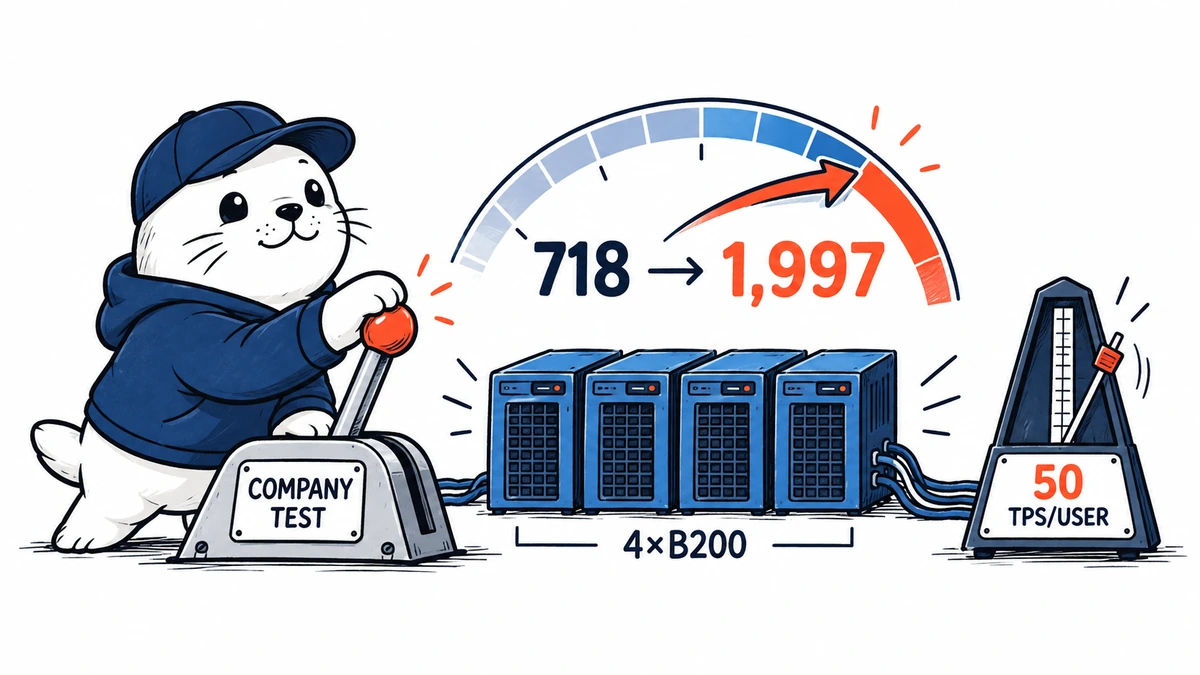
Company-reported result: NVIDIA says its optimized Nemotron 3 Ultra NIM served 1,997 output tokens per second on four B200 GPUs at a target of 50 tokens per second per user, compared with 718 tokens per second for its baseline stack.
The September 10, 2026 NVIDIA technical report describes the gain as up to 2.5 times more users on the same hardware. That headline is meaningful only with the test conditions attached, so this analysis reconstructs the workload before discussing what might transfer to another deployment.
The benchmark card, without the marketing shorthand
| Model and stack | Nemotron 3 Ultra, NIM 2.0.12 optimized serving stack versus a baseline with NIM optimizations off |
|---|---|
| Hardware | Four B200 GPUs |
| Workload | 64K input tokens, 400 output tokens, 76% key-value cache reuse |
| Interactivity target | 50 tokens per second per user, equivalent to 20 ms inter-token latency |
| Baseline throughput | 718 output tokens per second |
| Optimized throughput | 1,997 output tokens per second |
What the two throughput numbers imply
At the stated 50-token-per-second user target, dividing total throughput by the per-user target gives a rough capacity interpretation. The baseline corresponds to about 14 simultaneous token streams at that target, while the optimized result corresponds to about 40. Real serving capacity is more complicated because requests arrive and finish at different times, but the arithmetic explains NVIDIA’s user-capacity framing.
The measured ratio is approximately 2.78 when 1,997 is divided by 718. NVIDIA uses the more conservative phrase “up to 2.5x more users” in the headline and chart discussion. Capacity estimates can depend on rounding, scheduling and where the Pareto curve is read, so the published claim should be repeated with its target and hardware, not as a model-wide speed label.
The gain comes from a bundle, not one switch
- Model-aware, autotuned kernels for the hybrid architecture.
- Tensor parallelism across four GPUs and expert-aware execution.
- Prefix caching, partial-prefix matching and model-state reuse.
- Scheduler, batching, memory and concurrent-sequence tuning.
- Multi-token prediction speculative decoding plus associated fixes.
NVIDIA explicitly warns that the contributions interact and should not be added as independent percentage gains. That makes the NIM result a full-stack serving comparison, not proof that any single optimization will reproduce the same increase.
Why 76% cache reuse is a decisive condition
Agentic systems often repeat a large system prompt, tool schema or working context across steps. A workload with 76% key-value cache reuse rewards a stack that can recognize and retain those shared prefixes. A chat service with mostly unrelated prompts, short inputs or low reuse may see a smaller benefit even on the same GPUs.
This is why our DeepSeek cache and agent benchmark analysis separates cached-input economics from uncached performance. Cache assumptions shape both cost and capacity claims.
Where the result is likely to transfer, and where it may not
| Closer to NVIDIA’s test | Farther from NVIDIA’s test |
|---|---|
| Long repeated agent context | Mostly unique short prompts |
| High prefix reuse | Low or unstable cache reuse |
| Four B200 GPUs | Different GPU count or generation |
| 400-token responses | Very short or very long outputs |
| 50 TPS per-user target | Different latency service-level objective |
How to reproduce a decision-quality test
- Replay a trace with your real input-length, output-length and concurrency distributions.
- Measure cache reuse instead of assuming the published 76%.
- Build a throughput-versus-latency Pareto curve, not one peak number.
- Compare p50, p95 and p99 inter-token latency at each concurrency level.
- Record accepted output quality so speculative decoding does not hide regressions.
- Calculate cost per completed task, including idle and failed requests.
NVIDIA recommends using AIPerf to replay representative traffic and select the Pareto point that meets the application’s latency objective. The broader lesson also applies to coding-agent comparisons: a benchmark becomes actionable only when its workload resembles the work being purchased.
Our verdict on the 2.5x claim
NVIDIA provides unusually useful benchmark conditions for a vendor post, including hardware, context shape, cache reuse, latency target and both throughput values. That makes the result testable. It remains a company-run benchmark for one configuration. The correct takeaway is not that every Nemotron deployment becomes 2.5 times faster. It is that a tuned full stack can materially change capacity when the workload reuses long context, and buyers now have a concrete scenario to reproduce.
Primary source
Checked September 13, 2026. All performance figures are company-reported by NVIDIA. MustHave.ai has not independently reproduced this benchmark.